AI Product Analytics in Generative AI: What Traditional Dashboards Miss
AI product analytics connects user intent, model behavior, output quality, task completion, and cost. Learn the five-layer model for measuring LLM products.
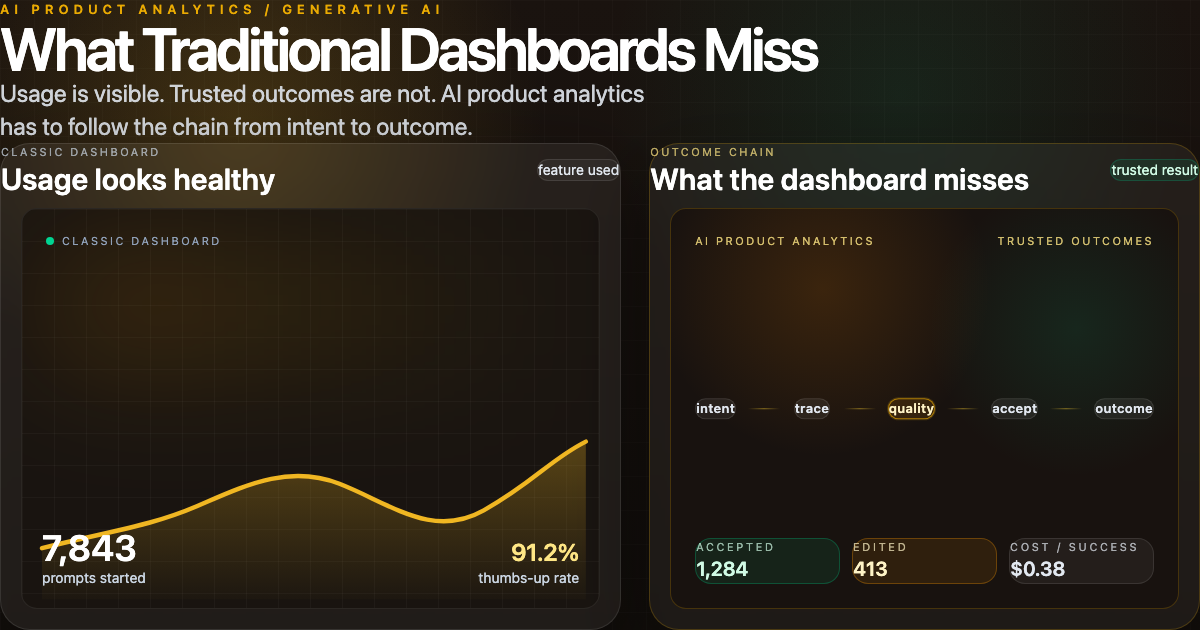
AI product analytics measures whether generative AI features create trusted outcomes, not just usage. Teams can still build generative AI features and still ship the wrong signal to leadership. The screen shows adoption, repeat sessions, and a rising feature usage line, yet teams do not know whether the output is accurate, accepted, or worth the cost. For AI products, the question starts at user intent and ends at business impact [2].
This has a practical consequence. In deterministic software, a session close often means the action is done. In LLM workflows, a closed conversation can mean confusion, manual verification, and silent failure. The practical move is to replace "feature used" with a chain of measurements that explains whether the AI interaction changed the user’s situation for the better.
What traditional dashboards miss.
Quick answer: How should product teams measure whether AI value was actually created?
AI product analytics connects user intent, model behavior, output quality, user acceptance, and business outcomes so teams can tell whether an AI feature created value. Start with a chain, not a single KPI.
- Track user intent and workflow context before any model call.
- Track trace behavior and model output quality at the level of each completion.
- Track acceptance, edits, escalations, and downstream completion signals.
- Track cost and latency and tie both to successful outcomes, not raw interaction count.
- Track outcome value, including retention and downstream task completion.
If one of those steps is missing, the final measurement is incomplete. Product analytics for AI is complete only when the team can connect what the model did to what the user accepted and what the work produced, in units that are comparable across time and prompts.
Why classic analytics fails for LLM products
Classic analytics tools were built for deterministic behavior, and they still do useful work. But they assume most product events are stable and equivalent. That assumption breaks for LLM interactions.
The same user can submit one goal twice and get two materially different outputs. Even if both responses are within acceptable latency and delivery windows, one can be usable and the other partially wrong. A dashboard that tracks only counts is blind to that difference.
This is why session-level signals often mislead teams. A support chatbot can close quickly after many messages. Some users still verify every answer before acting, and many users edit or discard outputs before they trust them. A simple funnel step says little about value in that setting, because it captures activity but not trust [6].
Explicit preference data is noisy too. In many AI products, thumbs-up events are sparse and biased. Vendor reports and enterprise experience point in the same direction: low explicit feedback can hide systematic quality problems, while high-volume prompts can still fail to move outcomes.
The 2025 AI in business report cited in community summaries says many enterprises saw pilots with weak business return while spending heavily on production pilots [1]. That is not proof that every AI deployment fails. It is evidence that teams are measuring the wrong chain and over-indexing on what is easy to count.
There are also workflow blind spots. AI systems can generate useful outputs with long delays, repeated context and retries, and tool-calling branches that look similar from the front-end perspective. Traditional funnels map linear journeys, not branching reasoning loops.
The five-layer model for AI product analytics
A better frame is to track five layers in order. This is not a list of tools or vendor slogans. It is a chain model that can be implemented with events and trace identifiers.
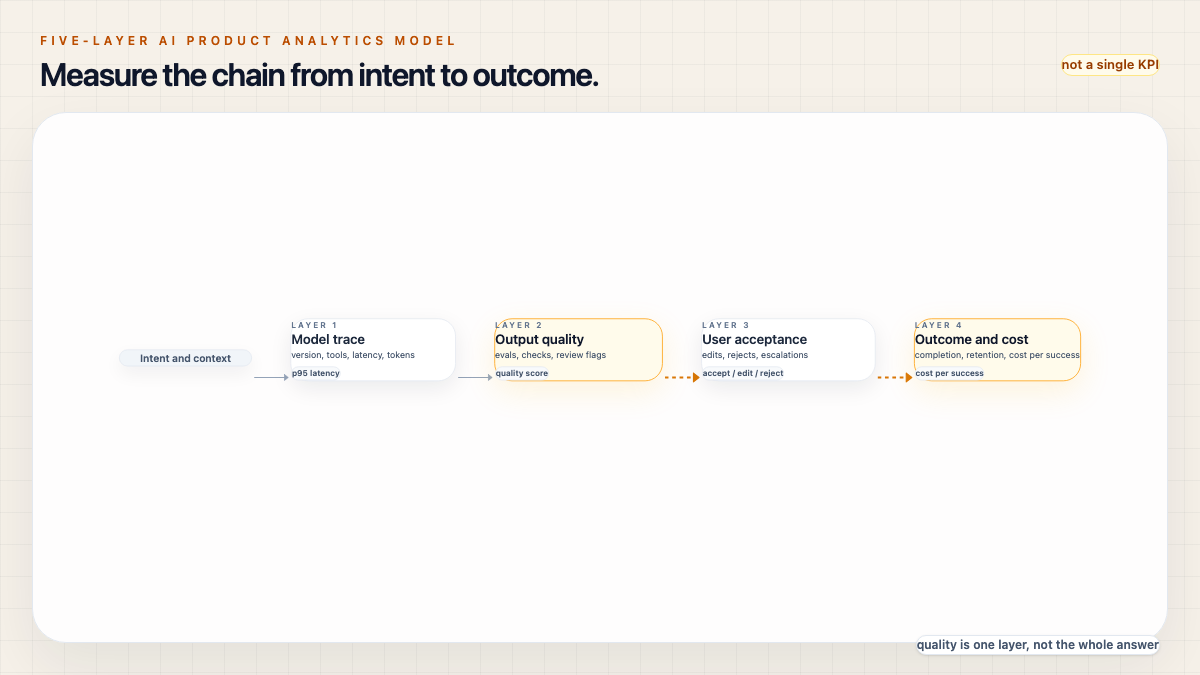
Measure the chain from intent to outcome.
| Layer | What to capture | Example metric | What it confirms | Failure mode if ignored |
|---|---|---|---|---|
| User intent and workflow context | Task type, workflow name, user objective, source context | intent tag coverage | Whether the model was asked the right job | Wrong task labels create wrong optimization |
| Model and trace behavior | Model version, prompt family, tool calls, tokens, latency, errors | p95 latency, input/output tokens, retry rate | Whether the technical layer is stable and bounded | Latent complexity is mistaken for model quality |
| Output quality and risk | Structured evals, factual checks, safety flags, human quality reviews | quality score by content family | Whether output is likely correct and usable | Fewer bad outputs can still hide slow, unsafe, or partial responses |
| User acceptance and completion behavior | Edits, manual corrections, escalations, accepted final state | accept/edit/reject ratio, escalation frequency | Whether the team can trust model output in the workflow | Positive clicks without sustained acceptance are treated as success |
| Outcome and unit economics | Task completion, revenue impact, retained value, cost per success | cost per successful outcome, task completion rate | Whether AI improved user-facing results for the business | Activity is treated as impact even when outcomes are weak |
The core design principle is one of matching granularity. If the user asked for two minutes of coding help, teams need to know whether the follow-through happened, not only that the answer appeared.
What to measure beyond usage and retention
A lot of teams still start with usage. That is the first layer, not the full model.
Usage and engagement
Use user and feature sessions to understand reach, not value. Active AI users, generation count, and repeat interactions are still useful to detect experimentation.
Quality and trust
Quality starts at output review. Practical signals include accept/edit/reject behavior, explicit corrections, and verification time. Microsoft HAX guidance covers AI behavior during interaction, when the system is wrong, and over time; in product analytics, repeated corrections are one useful signal that the same failure mode keeps returning [4].
Reliability and observability
Model-level logs and traceability are now required infrastructure, not optional extras. Microsoft and OpenTelemetry both define telemetry fields that make this practical: input and output tokens, trace identifiers, workflow naming, and evaluation labels [2] [3].
Cost and performance
Cost should be anchored to value, not activity. PostHog and similar sources split AI costs by interaction and by unit, but they also show that cost can be misleading if only total spend is tracked [7].
Business outcomes
For AI value questions, outcome data is where many teams drop the model. Did the AI interaction reduce manual work? Did it prevent follow-up support work? Did it improve completion rate without adding correction overhead? DORA and similar field reports show AI can speed local generation while reducing delivery throughput and stability when review burden and batch size grow. That is why outcome metrics need a quality dimension [5].
The practical taxonomy is:
| Metric group | Core signal | Example measure | Why teams need it | Common misuse |
|---|---|---|---|---|
| Adoption | Activity visibility | active AI users, sessions, repeat prompts | Detects reach and experimentation | Treating reach as successful outcomes |
| Quality | Trust and correctness signals | accept/edit/reject, correction depth, safety flags | Shows whether output moved work forward | Assuming one thumbs-up means sustained quality |
| Reliability | Technical health | p95 latency, retries, tool-call errors, trace completeness | Exposes instability before user frustration spreads | Ignoring long tail latency and failure modes |
| Cost | Efficiency | input/output tokens, cost per interaction, cost per success | Makes optimization trade-offs explicit | Chasing low spend while increasing manual repair |
| Outcome | Business value | task completion, resolution without rework, saved time, escalation ratio | Proves product impact in operational terms | Counting tasks as impact without accepted completion |
Where LLM observability helps and where it is not enough
LLM observability is essential. It gives the trace layer, quality pipelines, and debugging depth needed to understand what happened inside the model interaction.
Microsoft's observability guide places tracing, evaluation, quality gates, logs, and token visibility at the center of reliable AI operations [2]. OpenTelemetry gives machine-readable attributes for model and workflow tracing. LangSmith and Arize describe the same practical point from their own product perspectives: you need span-level visibility to root cause model behavior and not just final user actions [8] [9].
The mistake is treating observability data as a finished product analytics answer. Observability can answer "what did the model do" and "where did latency happen", but it does not answer "did this improve the real task." That step belongs to a separate layer.
A useful framing is this:
- Observability tracks model behavior.
- Product analytics tracks human outcome.
- The bridge is stable event and trace linkage.
If your team cannot join a user session to a trace to a task completion event, you are still at feature-level debugging. You are not at product-level measurement yet.
AI measurement in AI-assisted work: where durable state helps
The measurement problem looks smaller when work context is stable across sessions. Chat transcripts are short memory. A production workflow often needs durable memory.
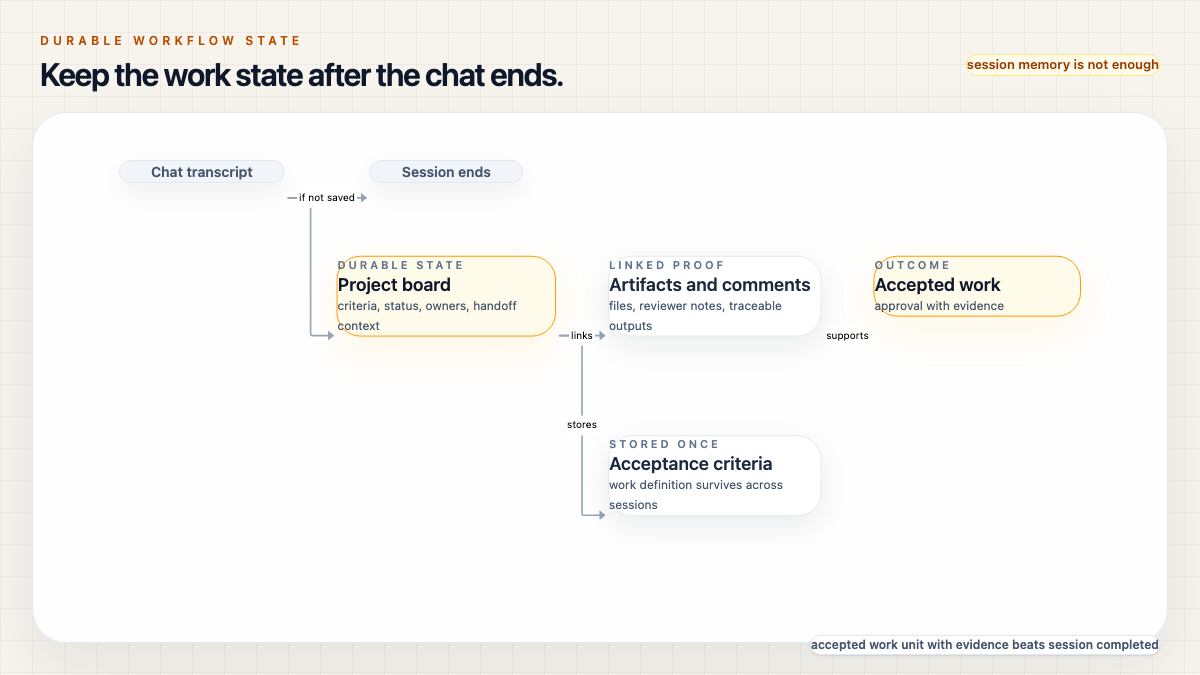
Keep the work state after the chat ends.
This is where durable project context for external AI assistants becomes useful. A project board can hold acceptance criteria, artifact links, status transitions, workflow locks, and ownership context outside the model session. That structure is why teams ship stronger AI workflows in practice.
AI coding team shared state and AI coding tool control surfaces describe why shared context and explicit handoff mechanics matter more than model cleverness alone. If context gets lost, no metric set can recover trust quickly. If context is stable, each step can emit meaningful completion and quality signals.
In Agiflow's project-board model, that state lives outside the chat thread, so acceptance criteria, handoffs, and review outcomes stay visible after the model session ends. For AI-assisted development and project work, the stronger metric is often accepted work unit with evidence, not agent session completed.
In a typical AI coding workflow, one model output can pass through multiple people and tools before final handoff. That means "completion" should be tied to work-unit acceptance, not chat session length. In other words, the denominator should include what was accepted with evidence, not only what was attempted.
The practical bridge is to pass a common identifier from task planning to evaluation data. Token efficiency in AI-assisted development and real MCP integration both show that tracing context and state transitions makes downstream measurement cheaper and more credible.
A practical checklist you can run this week
This is the minimum loop for a team that is already shipping AI features.
- Define the work outcome first. Every tracked event needs a target task outcome and expected artifact.
- Add trace IDs across model calls, user actions, and downstream task updates.
- Capture model details with workflow name, model identity, tool calls, token usage, latency, and error context.
- Capture behavior around acceptance and edits. A useful output accepted by the user is a different signal from a response that was only seen.
- Add automated evaluation where risk is high, then review trends by intent, model version, and prompt family.
- Track cost per successful outcome. Use raw success rate as a separate dimension and avoid cost-only optimization.
- Add a failure-mode column to every metric. If a metric rises and the failure mode also rises, do not call it a success.
Use the chain of ownership in your weekly meeting. If any of these are missing, the AI product analytics loop is still incomplete.
FAQ
What is AI product analytics?
AI product analytics is the connected process of measuring user intent, model behavior, output quality, user acceptance, and outcome impact in a single, auditable loop.
Why are usage metrics not enough for AI features?
Because usage counts only show interaction volume. They do not prove correctness, trust, or outcome completion. For AI, value often depends on how often users accept, edit, correct, and complete tasks after the output.
How do LLM observability and AI product analytics differ?
LLM observability gives trace-level detail about model behavior and execution. AI product analytics adds human outcome and business context. Both are needed, and neither replaces the other.
What is the best AI ROI metric?
There is no single best metric. Teams should pair cost per successful outcome with task completion quality. Any metric without outcome completion and failure-mode context should stay out of executive review.
How can teams measure output quality without overusing thumbs-up?
Pair explicit feedback with behavioral signals: edit volume, repeated prompts, escalation timing, verification effort, and task completion against the same objective.
References
[1] MLQ AI mirror report from the MIT NANDA 2025 State of AI in Business deck.
[2] Microsoft Learn, Observability in Generative AI.
[3] OpenTelemetry GenAI semantic conventions.
[4] Microsoft HAX Toolkit AI interaction guidelines.
[5] DORA GenAI report on impact patterns in software delivery.
[6] Mixpanel, AI product metrics.
[7] PostHog, product metrics for LLM apps.
More to read
Claude Code Internals: How Skills, Hooks, MCP, and Subagents Actually Work
A July 2026 refresh of Claude Code internals, separating official docs, first-party network traces, third-party analysis, and practical inference across CLAUDE.md, skills, hooks, subagents, plugins, and MCP.
32 min readChatGPT outdated business information: who can correct the source?
A former client reports outdated business information in ChatGPT. Verify the public record, identify its authorised owner, and scope the next action before promising a correction.
6 min readTyped Decisions for AI Agent Workflows: Record Before Routing
A typed model answer is an inference result, not a workflow transition. Record it once, pin the policy that consumes it, and replay the same decision without silently asking again.
12 min read